UsageWatch
Outage monitoring that already knows what a normal day looks like.
An estate of cameras, gates and message streams does not fail loudly. It fails quietly, on one lane, at one site, and nobody notices until a customer does. UsageWatch watches the shape of the traffic itself, and tells you when that shape changes.
Talk to us about UsageWatch →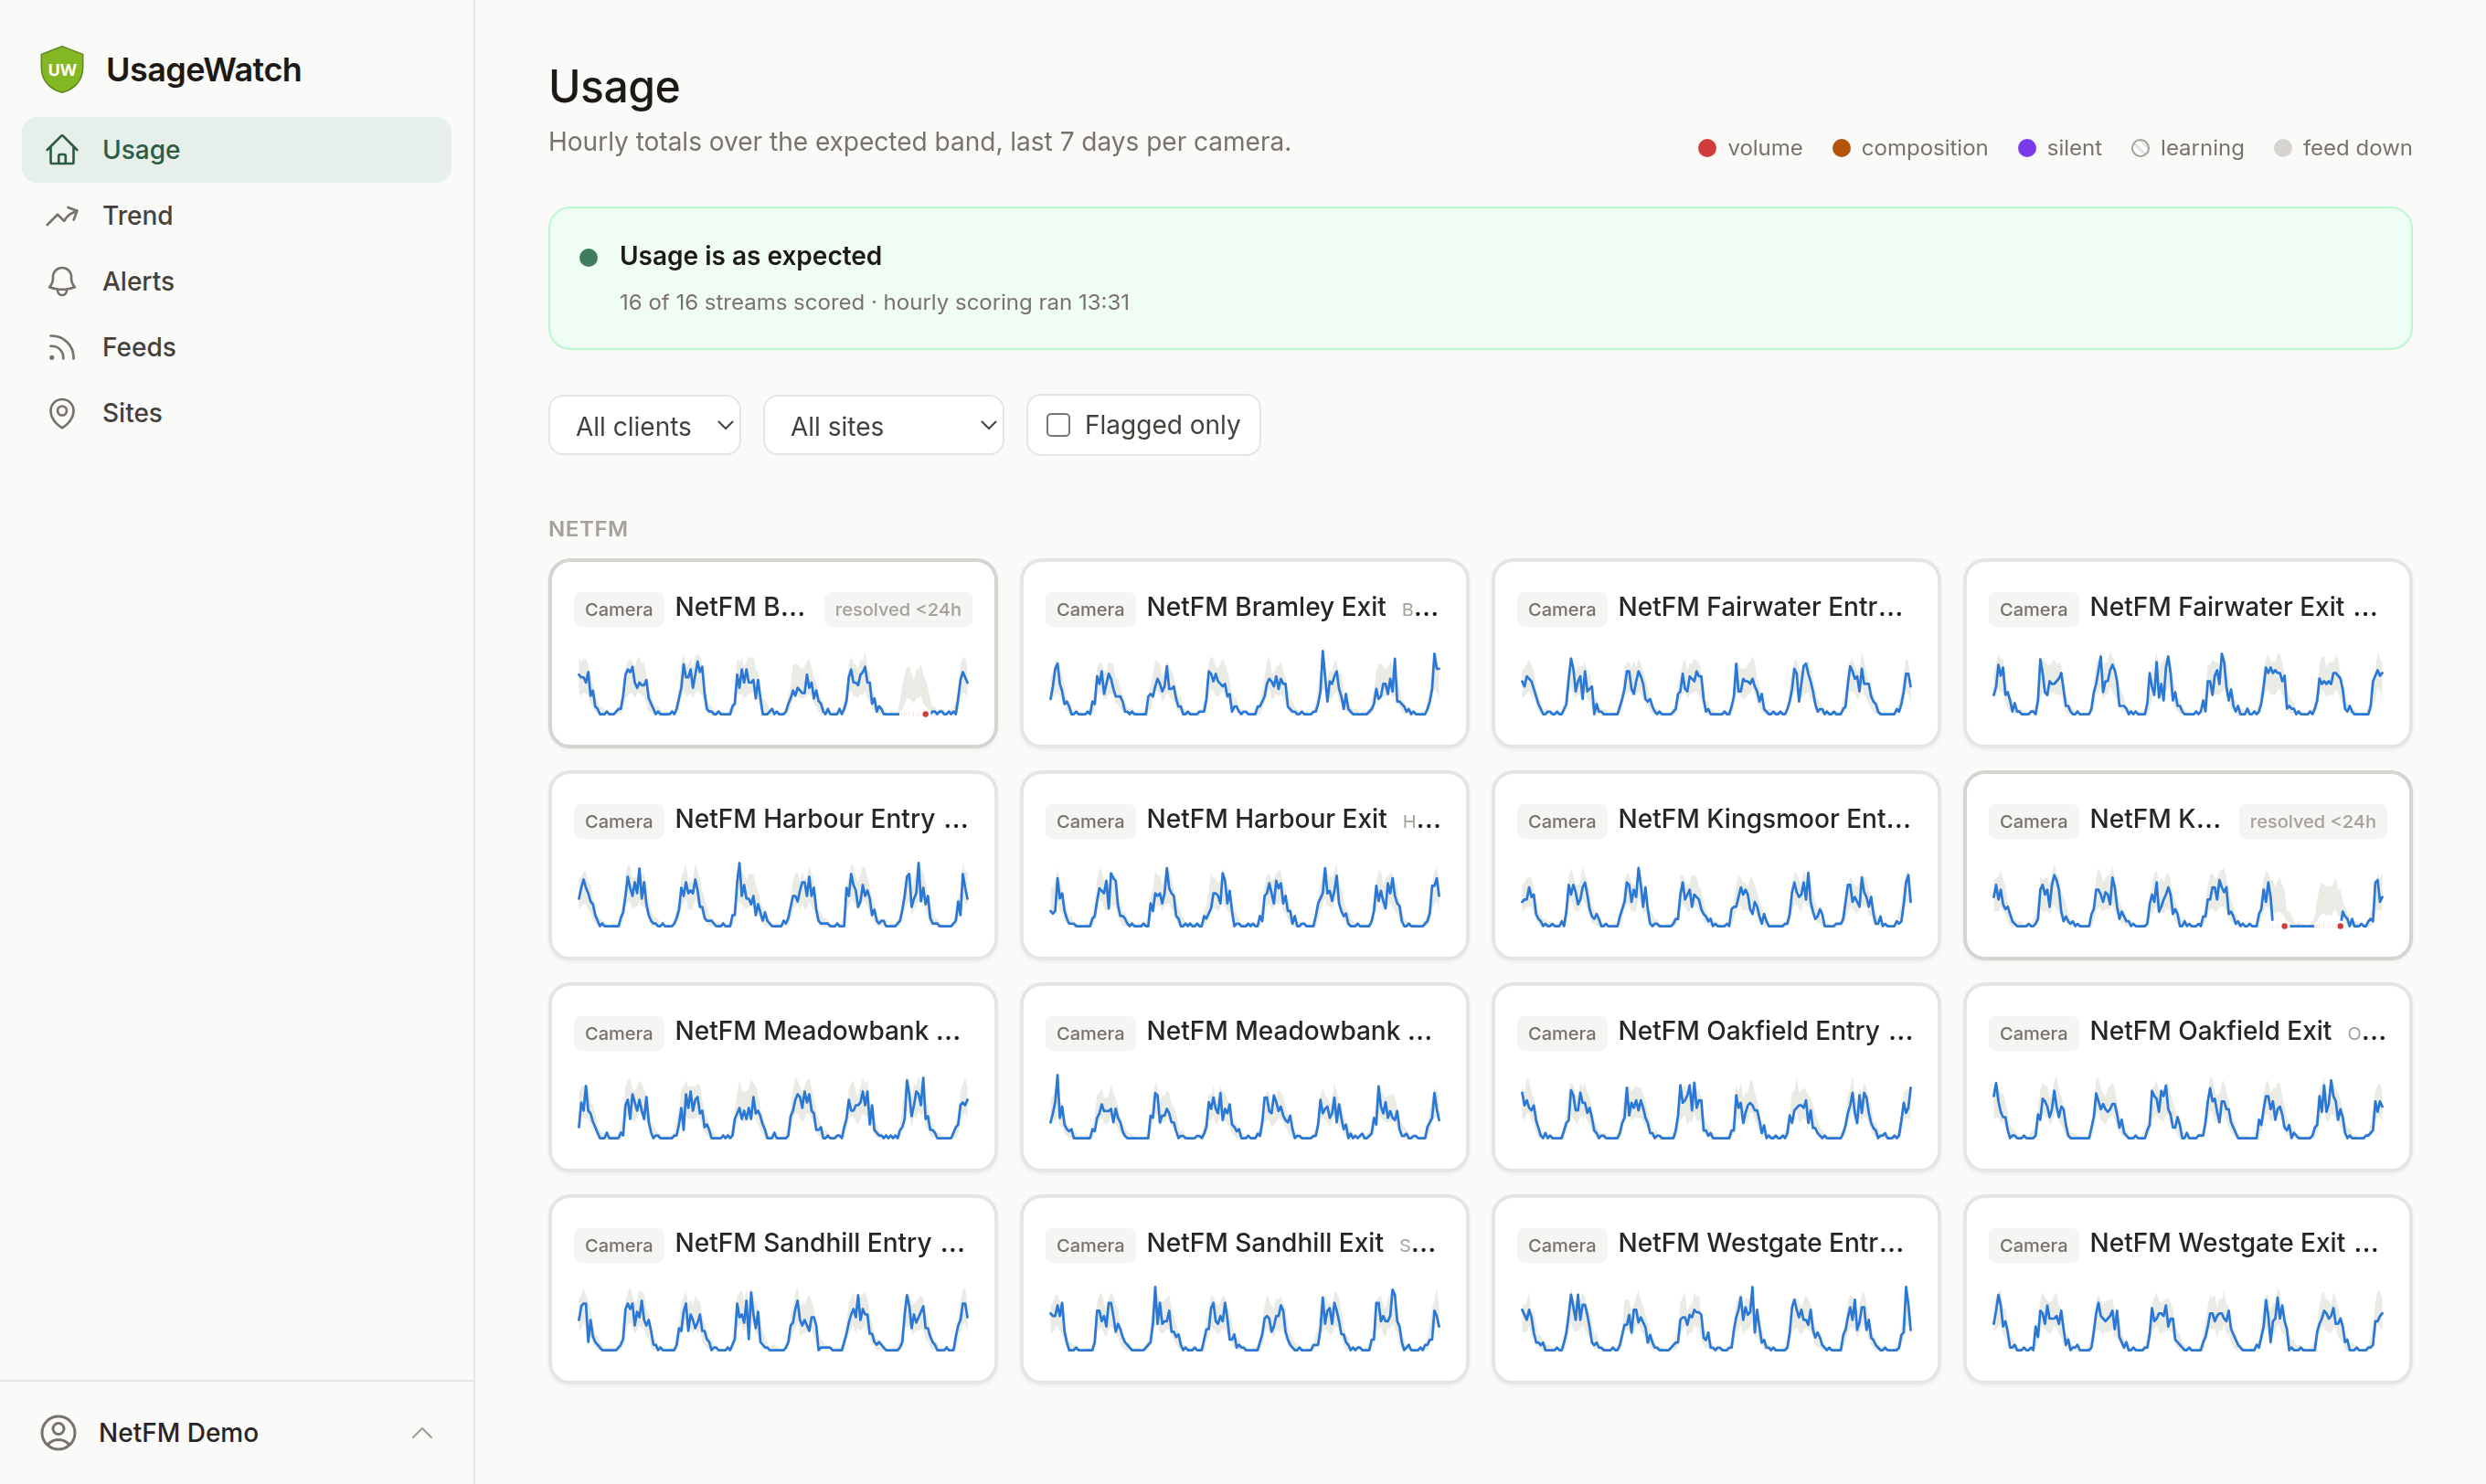
Every stream in the estate on one page, each with its own expected range. Anything that has drifted is flagged where you will see it.
How it works
No thresholds to set and no rules to maintain. UsageWatch learns each stream’s own rhythm and measures it against itself.
Collect
Every camera, message stream and scheduled file drop is polled on its own loop and folded into hourly totals. A stream that stops answering is marked degraded, then down, so a broken pipe is never mistaken for a quiet site.
Model
Each stream gets a statistical baseline refitted nightly over a twelve-week window, held separately for every hour of the week and weighted towards recent behaviour. Bank holidays are modelled against previous holidays rather than against ordinary weekdays.
Detect
As each hour closes it is scored against that baseline. Volume outside the expected range, a shift in the mix of event types, or a run of silence long enough to be improbable opens an anomaly and clears it again automatically when the stream recovers.
The Anatomy of an Outage
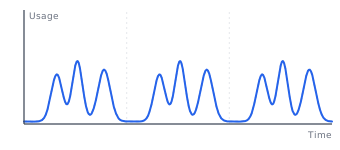
Every stream has a shape. A normal day has three peaks — morning, lunchtime and evening — and the area under that curve is the usage you would expect to see. When something breaks, what matters is not just the dip, but how much of that area you ever get back.
Normal
Actual usage tracks the expected curve. Three peaks a day — morning, lunchtime and evening — and the area beneath them is the day’s total.
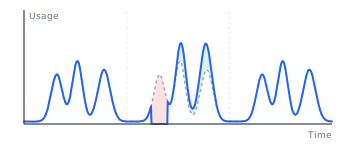
Hiccup
A brief loss, then an overshoot as the backlog clears. What was lost is paid straight back, so there is no lasting effect.
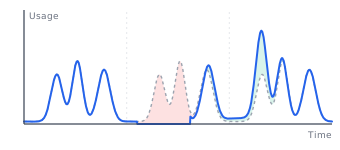
Deficit
A longer loss. Customers go elsewhere and only some of them return, so far less is regained than went missing.
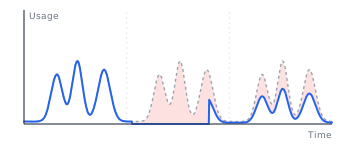
Erosion
A prolonged loss takes trust with it. Usage never climbs back to the line, and the deficit becomes permanent.
Classification of Cause of an Outage
A drop in the numbers has two very different explanations, and they need two different people to fix them. UsageWatch tells them apart before it raises anything.
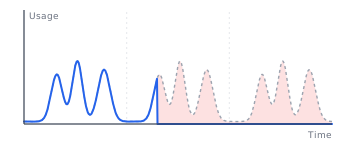
Infrastructure
The signal stops dead. A camera drops off, a feed goes down, an overnight delivery never lands — and the stream reads exactly zero, a number real traffic almost never produces. UsageWatch holds the site’s counters open rather than reporting every camera behind a broken pipe as faulty.
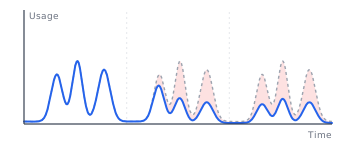
Behaviour
The signal keeps coming, but the pattern moves. Volume settles below the expected range, or the mix of approved, denied and unrecognised reads shifts. The equipment is fine — something changed on the ground, and that is a different conversation.
Want it watching your estate?
UsageWatch runs across NetFM’s own managed estates today. If you would like it pointed at yours, we would be glad to talk it through.
Get in touch →